
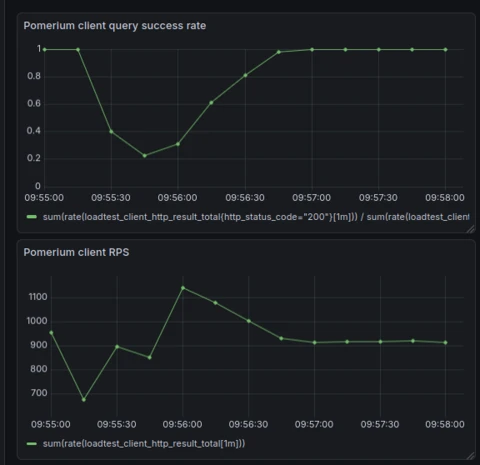
We had a problem. Our services were technically “healthy,” but users didn’t see it that way. Containers would spin up, report as ready, and yet still fail requests because the underlying systems weren’t fully “initialized” — more on that later. Client success rates would tank faster than a bad day on the stock market:
Why? Traditional health checks like your typical HTTP keep-alives just weren’t cutting it. They told us whether a process was alive, not whether it was actually ready. So we built something smarter: a stack-aware health check system that surfaces real readiness signals across Kubernetes probes, Docker health checks, and even systemd notifications. This is the design story behind how we went from a near 0% client query success rate to a ≥99.9% success rate during horizontal scaling, application restarts and rollouts:
Most backend developers have written one — that little /health endpoint quietly keeping everything alive. If you’ve built an API, you’ve probably had to implement one. Most often, it exists to support infrastructure maintenance whether done manually or through an automated system.
When combined with automation, health checks enable self-healing behavior across a group of instances by isolating problems to individual workers. This self-healing behavior is an essential aspect of paving the way to near-zero downtime availability for backend services.
These days, health checks are typically built for a specific integration; the Kubernetes Orchestrator.
For those who aren’t deeply familiar with it, Kubernetes is an open-source system that automates the deployment and management of containerized applications. While Docker lets you package applications into containers, Kubernetes handles running and scaling those containers across clusters of machines. Over the past decade, it’s become the de facto standard for managing cloud infrastructure at scale.
Health checks are an often overlooked but sometimes critical part of the Kubernetes high-availability guarantees for your workloads. These checks are used by the Orchestrator to control the pod lifecycle, and the pod lifecycle is at the core of horizontal scaling and application roll-outs.
Under the hood, containers managed by a worker pool first go through an initialization phase before being added to the set of “active” machines. From there, readiness checks continuously determine whether a container should be included in the pool of valid targets for incoming traffic, adding or removing it as conditions change. And when a container is scheduled for termination, the runtime sends it a system signal and waits for the pod termination grace period—giving the main process time to exit cleanly—before finally forcing cleanup.
Kubernetes introduces three types of health checks that play a part in the pod lifecycle: startup, readiness, and liveness probes, each serving their own purpose. Applications implement these probes by adhering to a simple “type contract,” exposing endpoints or signals that let Kubernetes know their current state. Each Kubernetes probe follows an eventually consistent model: a failure threshold determines the number of consecutive failures required to mark a check as failed, while a success threshold determines the number of consecutive successes needed to mark it as successful.
Startup probes indicate whether or not an application is still initializing and not yet ready to be added to pool of available workers.
Readiness probes determine whether or not an application in the pool of workers is ready to serve incoming network traffic.
Liveness probes indicate whether an application continues to function correctly; if a liveness check fails, the application is forcibly stopped and removed from the pool of active workers.
Pomerium did have that quiet /health endpoint keeping things alive… The problem? At scale, It didn’t achieve that near-zero downtime high availability that Kubernetes promises. (Kubernetes doesn’t care about your feelings)
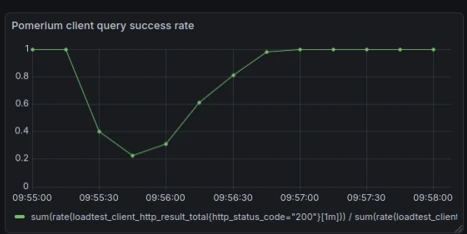
Before we added the smarter health checks, this is what client request success rates looked like in my load tests when restarting and rolling out the worker pool of Pomerium instances:
Even at a modest scale, when end users rolled out a new version of Pomerium, client request success rates would drop to nearly zero for the new replicas being added to the worker pool.
In load tests measuring in at around 1,000 requests per second, downtime lasted roughly 30 seconds. For users operating at a much larger scale, the impact could be significantly longer. This made version upgrades and horizontal scaling challenging for our end users.
So why were our existing health checks not hitting the mark? What does it mean for Pomerium to be healthy? ready? initialized? The answer isn’t so straightforward.
Pomerium, at a glance, is a secure, context-aware, zero-trust reverse proxy with fine grained protocol support.
At the very minimum, to implement a proxy capable of these things, you need:
An authentication engine: managing user identity and sessions
An authorization engine: managing who is authorized to do what
A proxy engine: handling the actual “proxy” part of the proxy
A storage engine: managing the state and configuration of all the other services
Zero-trust means that every request being proxied through Pomerium has to go through a strict verification chain before being redirected upstream. First the authentication service verifies that that the request is associated with a valid user. Then the authorization service verifies that the user associated with that request has access to the upstream resource. Finally, the proxy service can offload the request to the upstream resource and wait for a response.
If any link in this chain becomes stale, then Pomerium might be “up and running” but not ready to serve traffic!
Pomerium is designed to act as a gateway to services that you want to secure behind a single pane of glass. It needs to deliver first-class performance, striking a practical balance between availability, consistency, and latency.
Our proxy engine is based on Envoy, a battle-tested high-performance reverse-proxy. Our storage engines give us atomic and consistent operations. However, the objects stored in our databases still need to be synchronized with the rest of our services, namely the authentication engine, authorization engine, and Envoy itself.
Pomerium implements a strongly eventually consistent synchronization handler that manages the often times complex state updates across services. A key part of making this work is the durable and consistent storage backend guarantees, along with a strict monotonic versioning scheme that processes configuration objects, which we call “records”, in a well-defined, strictly ordered sequence.
Another architectural decision that enables Pomerium to be the highly available proxy it is, is that the entire configuration is hot-reloadable. Configuration changes are propagated on demand while the service continues running. With several configuration drivers, this also adds to the complexity of determining the current health of Pomerium services.
The stateful nature of Pomerium poses some particularly hard problems to solve for paving the way to self-healing health checks:
How should we model the state of the application?
How should we model tracking the state of the application?
What signals are context-aware enough?
The design goal that’s always at the forefront of my mind is to try and keep things simple, while accounting for more complex use-cases.
So I ended up starting with the following high level design goals for modeling state:
State should be localized: each component or subsystem should report its own internal state rather than mutating a shared global state. This makes it easier to reason about behavior, isolate failures, and reduce the risk of unintended side effects when one part of the system changes.
State should be granular but comprehensive: the state should capture enough detail to provide meaningful insights into the system’s health, without being overly coarse or too aggregated. At the same time, it should cover all critical components so that no major failure goes unnoticed.
State should be consistent: in a highly concurrent world, updates and reads can happen simultaneously, so the system must ensure that reported state reflects a coherent view, avoiding contradictions or partial updates that could mislead health checks
In my previous work experience with implementing distributed systems, I encountered the concept of service models. Backends like Cortex and Pyroscope, both very sophisticated backend systems, offer all-in-one and split-service modes, which they conveniently manage through a service model abstraction. Notably, Cortex follows the Google Guava Service model.
While Pomerium doesn’t explicitly define a service model interface, its architecture behaves much like one. It consists of multiple backend services that can run independently or together, making the analogy to service models, and in particular, how they represent state, highly relevant.
Taking a look at how google’s large-scale service model handles health and state, gave me an excellent jumping off point for how to design our own state tracking. In practice, I probably wouldn’t need to consider more granular states than the ones defined by the Guava Service model in Pomerium’s own state implementation.
In the end, I ended up with states corresponding to three major categories:
Starting: we need to do some work before being ready
Running: everything is working great
Terminating: we need to gracefully stop what we are doing
A major departure from the Guava Service model states is that each state value has an optional error attached to it—the absence of an error means the state is healthy.
Next, I moved on how best to solve localizing the state. The most intuitive and simple idea is to use a hash map to map a state based on it’s human-readable ID to it’s value. Indeed, this is the implementation I went with.
In one of my prototypes for the feature, I considered an abstraction where states could have parent and children states:
In essence, the parent states would be healthy / unhealthy if-and-only-if all their children states were healthy / unhealthy. The SDK also allowed dynamically registering and de-registering child states, which offered additional flexibility.
In the end, the approach ended up being more sophisticated than necessary. The approach added more complexity without much real benefit because only a few components had co-related health checks. The simpler and more practical solution was to continue with the first approach while sensibly grouping related states using a shared prefix in their ID. For example, granular checks around a storage backend would be written out with storage.<check-id>.
If the health check implementations require more detail in the future, maybe I’ll get to the opportunity to re-review how hierarchical states could fit into Pomerium’s health checks.
State transitions are meant to be atomic. A specific check can only move once between Starting and Running and similarly between Running and Terminating . This design has a useful of side-effect of making logical mistakes fail loudly. Pomerium won’t serve traffic if one of it’s components mistakenly moves to Terminating!
Similarly, state updates are buffered. A new state replaces the previous one only if it has actually changed. This helps reduce unnecessary churn and ensures that transitions reflect meaningful updates rather than repetitive or transient signals.
Because the number of tracked states is small (of the order 10^3) compared to the scale of the application (millions of requests), we can safely use a mutex for each state with minimal performance impact. Error comparison is also efficient thanks to errors.Is, which walks the error tree, a structure that remains shallow compared to the length of typical error strings. This avoids using frequent and potentially costly string equality checks, which are O(n) in the length of the string when the error strings are equal, the most common case we expect when comparing if two reported errors for a state are equal.
When I started implementing health checks for Pomerium, I quickly realized how blurry the line can get between what belongs in a health check and what should live in a telemetry signal. Both should inform you how the system is behaving, but both operate at very different levels of granularity and scope.
For example, when managing Pomerium through our Enterprise Console, the Console uses the Pomerium API to create configurations. It’s tempting to fold something like configuration drift into the health checks, to make sure when the instance serves traffic, it serves only the most up to date state. But then you have to ask, what level of drift is acceptable? I think the answer will depend heavily on the specific use case each customer has for Pomerium. Some of the problems you run into with state and consistency can’t be completely solved through health checks.
That’s where I decided to draw the line between granularity and feasibility. Checks that depend on cross-cutting concerns or cumulative state are better surfaced through your typical telemetry signals like metrics, logs, alerts, or dashboards. Health checks, on the other hand, should focus on the current state of the instance, based only on what it can deterministically evaluate as a valid state.
One of the biggest challenges in complex applications is managing a large amount of states across components and figuring out the best way to abstract their management and collection.
I prefer to approach this from a data-driven perspective, starting with a simple question: do you want to check the state actively or passively? In other words, I looked at the problem of tracking state as a “push versus pull” problem, much like an ETL process, where data can either be pushed to a system or pulled when needed.
Usually the more common approach is a pull driven implementation for health probes, like registering function callbacks:
type State int
type HealthCheck func(ctx context.Context) (state State)
func (s *Service) RegisterCheck(checkID string, check HealtCheck) { s.checks[checkID] = check
}
func (s *Service) healthProbe(w http.ResponseWriter, r *http.Request) {
  for id, check := range s.checks{
	if state := check() state != /* some state */ {
	  	w.WriteHeader(http.StatusServiceUnaivalable)
	  	// ...
	  	return
  		}
	}
	w.WriteHeader(http.StatusOK)
	//...
}
I like this approach because it’s easy to test individual HealthChecks, encapsulate them on structs, write utility packages around them and get into a debugger if things get real. The pull-based approach tends to work well everywhere in your backend, and can be further extended in functionality by swapping out the function alias to an interface.
The downsides are mostly minor. Each check runs when the probe is called, which adds a small amount of latency and resource usage when the state is computed. It can also be tricky to reason about failures since there’s always a non-trivial amount of janky stuff you can shove into a function definition — the SDK leaves it up to the implementers to track state. That can lead to split-brain implementations and friction when implementing checks holistically across components.
On the other hand, a push-based approach might look like:
package health
type State int
func ReportStatus(check string, state State) {
  cache.ReportStatus(check, state)
}
// --------------------------------------------------------
package backend_a

func (a *backendA) longInitTask() {
  defer health.ReportStatus("backendA", health.Running)
  //...
}
// ---------------------------------------------------------
package main

func (s *Service) func (s *Service) healthProbe(w http.ResponseWriter, r *http.Request) {
  if err := aggregateState(cache); err != nil {
	w.WriteHeader(http.StatusServiceUnavailable) return
  }
  w.WriteHeader(http.StatusOK)
}
Push-based checks are extremely convenient because they let you centralize all state logic, keep probe latency consistent and predictable, and simplify reporting health from a code perspective in the core Pomerium logic. They also make it easier to enforce strict state guarantees across components and fail more loudly when a developer writes something that doesn’t logically fit with our state model.
The trade-offs of the push-based approach is that it can be harder to test in isolation, and bugs tend to be nastier — a single mistake can ripple through the aggregated view presented to a health check integration, like the Kubernetes probes. But these tradeoffs fit the philosophy that bugs caused by logical mistakes from the programmer should fail loudly.
The pull option is for me the more appealing option, and and it’s often the one I’d choose for my backend services. In practice though, the main Pomerium state tracking mechanism actually ended up following the push model.
It was a tough call, but I found that eventual consistency patterns don’t mesh well with a purely pull-based approach. A push-based model lets you minimize changes to application logic and abstract away the complex parts inside the health management system. With a pull-based model, the centralized system becomes increasingly harder to reason about, even though local behavior stays relatively understandable.
The push-based model flips that tradeoff: it makes the centralized system easier to reason about, but forces developers to think more carefully about local behavior, even if it keeps the code changes minimal.
For example, in our bidirectional management stream to envoy, we would end up having multiple checks that all do something very similar:
// a very simplified example of an eventually consistent task-set
func (m *ManagementServer) run() {
  for result := <- taskC{
	if result.Err() {
	  m.latestResult.Store(err)
	  // requeue task
	  requeue <- result.Task()
	  continue
	}
	defer m.latestResult.Store(StateRunning)
	// process the task result
	// ...
  }
}

func (m *ManagementServer) healthCheck() state {
  if err := m.latestResult.Err(); err != nil {
	return StateError(err)
  } else {
	return m.latestResult.State()
  }
}
Hopefully, you can see how extending this example to a task with multiple steps, concurrent patterns, several functions, and nested control flow can quickly become overwhelming and frustrating to mutate or track the state of operations, which will later be pulled by the health management system. Since much of the Pomerium behaviour relies on eventually consistent patterns, you would end up having to customize this approach to several different components on a case-by-case basis.
The push based mechanism resulted in seamless integration with our existing patterns like:
for result := <- taskC{
  if result.Err() {
	health.ReportError("task",err)
	// requeue task
	requeue <- result.Task()
	continue
  }
  defer health.ReportRunning("task")
  // process the task result
  // ...
}
You don’t need to track statuses across functions or go-routines, and suddenly the checks became much more readable. The tradeoff is that developers adding health checks to their components now have to think more carefully about how those checks behave in their control flow.
And if needed, you can always layer a pull-style mechanism on top of the push system. For example, I used this strategy to implement a health baseline for our envoy backend. A simplified version of the implementation looks like:
t := time.NewTicker(time.Minute)
defer t.Stop()
for t.C{
  if err := envoy.Ping(context.TODO()); err != nil {
	health.ReportError("envoy.ping", err)
  } else {
	health.ReportRunning("envoy.ping")
  }
}Everything in Pomerium starts asynchronously, so timing becomes unpredictable. Components may become ready very quickly, and state updates can easily happen before our mechanism is ready to receive them. This creates a real risk of missing early signals like a service reporting that it’s ready or, worse, that it’s failing.
Since we don’t have a clear service encapsulation model and components start asynchronously, the simplest way to ensure the state tracker is available without startup race conditions is by using a singleton pattern in Go:
var Tracker HealthTracker
func init() {
  Tracker = newGlobalTracker()
}
It’s not the cleanest solution from an architecture perspective but otherwise we’d have to inject the health tracker state pointer everywhere Pomerium wants to report a state. In the future, we may introduce a service model for Pomerium components that abstracts this away, hooking into the service model lifecycle directly and automatically encapsulating the tracker by passing its pointer to each service registered to the model.
So far we’ve designed what I think is a pretty reasonable way to model and track state.
If you’ve ever worked with messaging queues, you’ve probably heard the term “at least once.” It means messages are guaranteed to reach each recipient, even if duplicates occur. I drew a similar parallel for our health checks: every synchronization handler must complete a full cycle at least once whenever Pomerium starts or hot-restarts.
Eventually consistent models can be tricky to reason about. The goal is to ensure we always eventually reach the correct outcome, and for our synchronization handlers, we also need to know when a failure becomes consistently observable. Thanks to the monotonically increasing versioning in our handlers, any success in the loop usually signals that we’re not hitting an eventually consistent failure.
In particular, the smarter health checks reflect the “at least once” propagation cycle for user sessions, policy enforcement and proxy routing configuration, and leader-follower synchronization in our new clustered-mode, and proceeds to continuously monitor them for consistent failure. Alongside these improvements, some more granular active checks for dependencies that are critical to Pomerium’s operation were introduced, like to envoy and our databases.
Some important updates were also made to graceful termination behavior.
The main Pomerium process delegates the proxy engine part of its operation to an envoy instance managed via a sub-process. When a container is scheduled for termination, it sends SIGINT to the main Pomerium process, and once that exits, all remaining processes are forcibly cleaned up. At a small scale, this seemed to work as intended — Pomerium had enough time to send it’s own SIGINT to Envoy, letting it gracefully drain connections. At a larger scale, however, Envoy could be killed before finishing its shutdown. The main process now proxies (pun intended) container shutdown signals to the Envoy subprocess, ensuring that Envoy completes its graceful shutdown before the main process exits and the container tears down the remaining processes.
One thing I intentionally did not highlight in these previous sections is the need to adapt the above two mechanism to multiple target environments - not just your typical Kubernetes probes. Extensibility was at the core of the design. Our customers run Pomerium everywhere; from their homelab linux servers to hyper-scaler Kubernetes environments.
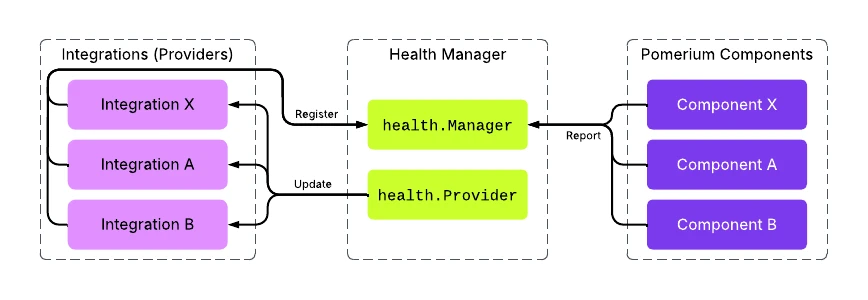
To address this, I introduced an abstraction, called the health manager, capable of reporting health updates to a variety of mechanisms - on an as-needed basis.
When we discussed the strategy for de-duplicating and handling state transitions, that logic can now be centralized in the health manager implementation. It’s transparent to the integrations and the SDK used to report status in Pomerium components. Integrations only see the latest relevant updates from the health manager and never miss an update, crucial for our hot-config reload architecture, which can enable or disable particular integrations on the fly.
One challenge that arises when reloading configuration is that the set of expected checks—or the statuses received by particular health integrations—may change, or entire services may need to reload from scratch.
To handle this, we maintain a replay buffer that tracks state changes without immediately pushing them to a provider. Whenever a new integration is configured to receive health checks, the manager can replay the latest known state for each tracked item to that integration.
Since our state modeling system is fully separated from the application logic, this centralized mechanism could also be extended to other output signals—such as metrics, traces, or logs - or even extended to coordinate internal tasks between services via hooks into particular state transitions. How these additional signals are presented would require careful consideration to ensure they provide useful information to end users without introducing noise.
For these smarter health checks, Pomerium supports three major integrations out of the box: Kubernetes, Docker and systemd.
In Kubernetes, our startup probe checks that each registered check has reported Running successfully at least once. It doesn’t matter if a component is currently erroring—we know the system has successfully started thanks to the “at least once” semantics described in the previous section.
Our readiness probes check that all components are in the Running state and that each reports no errors. The failure threshold, the number of consecutive times Kubernetes evaluates the probe as failing is set much lower than for the liveness probe, allowing transient errors to occur without tearing down the container, and starting over from scratch.
Our liveness probes check that all components are not in an error state. Importantly, Terminating is still considered healthy, allowing for graceful shutdown tasks to complete without the orchestrator forcibly terminating the application. Persistent errors encountered in the Terminating state will eventually cause the liveness probe to fail, ensuring the “kill switch” can be triggered before the termination grace period expires, enabling faster recovery.
Docker doesn’t provide advanced mechanisms for evaluating health checks. It only offers a single probe-like feature called HEALTHCHECK, which can be defined in the Dockerfile or configured in a docker-compose file. The HEALTHCHECK directive runs a specified shell command, and any non-zero exit code is considered unhealthy. Controversially, docker doesn’t actually implement any self-healing automation on it’s own. Docker simply updates a field in the container state, visible via docker ps or docker inspect . In Docker Compose, the only automation around this field is used to prevent dependent containers from starting until the dependency has reported itself as ready. However, some container management services, like Amazon’s ECS, use this configuration option to implement self-healing behavior, enabling the near-zero downtime availability we aim to achieve in these types of environments.
Crucially, because Docker only provides a single entry point for health checks, we have to be stricter and less granular than with Kubernetes probes. We must enforce the equivalent of a liveness probe at every stage of the container lifecycle, with the notable exception that the Terminating state is no longer considered healthy.
Systemd is a bit of a quirky system. Like Docker health checks, it doesn’t reach the sophistication of Kubernetes probes, but it brings its own set of features to the table. Updates flow through a managed unix socket, which uses the sd_notify protocol. The watchdog extension of the protocol can terminate unhealthy instances via a Unix signal, allowing Pomerium to go through its graceful shutdown phase before restarting.
The READY=1 status is used to tell systemd that the service has finished its initialization and is now fully operational. This allows systemd to manage dependencies correctly, only starting services that rely on this one once it signals readiness. Current status and errors can be surfaced through user-facing systemctl commands, though the reporting is limited. In our implementation, I opted to expose the most recent error in the status section.
What’s particularly interesting is that the sd_notify protocol is sophisticated enough that we could feasibly re-implement a version of Kubernetes-style health checks using the watchdog interface. Users would be able to configure failure and success thresholds for different lifecycle checks through the Pomerium configuration. Sadly, there hasn’t been a compelling enough reason to reinvent that wheel yet, but perhaps someday there will be.
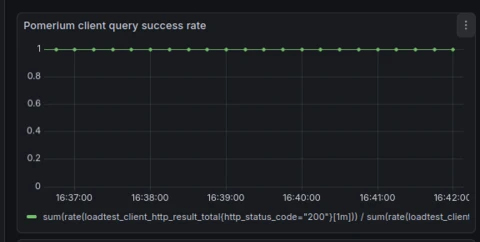
In Kubernetes, when restarting a worker pool of five instances serving roughly ~1000 requests per second, I compared the client HTTP request success rate side-by-side. On the left is the success rate before the smarter health checks were in place, and on the right is the success rate after they were implemented.
In my load tests, at most 3 out of the roughly 30,000 requests would fail with errors when signaling a restart to the worker pool with the smarter health checks enabled. These failures were simple EOF errors and were easily retryable by clients. For other protocols like WebSockets, Pomerium now reliably drains active connections when entering the Terminating state by sending the appropriate control frames to clients before shutting down and scheduling new workers.
Pomerium v0.31 includes these smarter health checks and other features that enable zero-downtime high-availability! Read more on our docs or check out the Github package.
Note: feel free to check out the final implementation in pkg/health , it’s pretty self-contained.
Stay up to date with Pomerium news and announcements.
Embrace Seamless Resource Access, Robust Zero Trust Integration, and Streamlined Compliance with Our App.

Use Cases
Quicklinks
Stay Connected
Stay up to date with Pomerium news and announcements.


