Pomerium allows you to securely access Kubernetes APIs, internal apps, databases, and more — without a VPN. But even with faster, direct access, understanding performance issues or request failures in a distributed environment still requires the right observability to trace what’s happening behind the scenes.
That’s why we’re excited to announce Pomerium’s newly improved OpenTelemetry (OTEL) tracing support! With detailed, contextual tracing, following request flows across Pomerium and your apps just became far easier—and a lot more delightful.
OpenTelemetry is an open-source observability framework that standardizes how applications collect, process, and export telemetry data such as metrics, traces, and logs. It’s the successor to OpenCensus and OpenTracing, and is now the de facto industry standard for modern observability.
Previously, Pomerium used OpenCensus for tracing. However, OpenCensus has been deprecated, and upstream projects — including Envoy Proxy — have removed support for it entirely.
(If you haven’t run into it before: Pomerium is built on Envoy Proxy, a modern, battle-tested Layer 7 proxy that powers huge production systems at companies like Lyft, Apple, and Shopify. Envoy gives Pomerium a solid foundation for scalability, observability, and modern protocol support.)
Key reasons for moving to OpenTelemetry:
Future-proofing: OTLP (OpenTelemetry Protocol) is now the ubiquitous standard across most observability tools.
Deeper tracing: OpenCensus could not trace request flows end-to-end through Pomerium and Envoy.
Better integration: OpenTelemetry support ensures broad compatibility with a wide range of collectors and backends like Jaeger, Tempo, and Honeycomb.
Now, Pomerium’s request tracing flows seamlessly from Envoy into Pomerium’s core services — and you can export it into any OTLP-compatible backend like Jaeger, Tempo, Honeycomb, or others.
Traces capture the full context of a request — from the moment it enters the system to all the internal services it touches.
While logs and metrics show individual points of data, traces show the journey of a request across systems.
As a context- and identify-aware proxy, Pomerium often acts as the critical entrypoint into your distributed systems, especially when handling:
Authentication (OAuth/OIDC flows)
Authorization decisions
Secure routing to protected upstream services
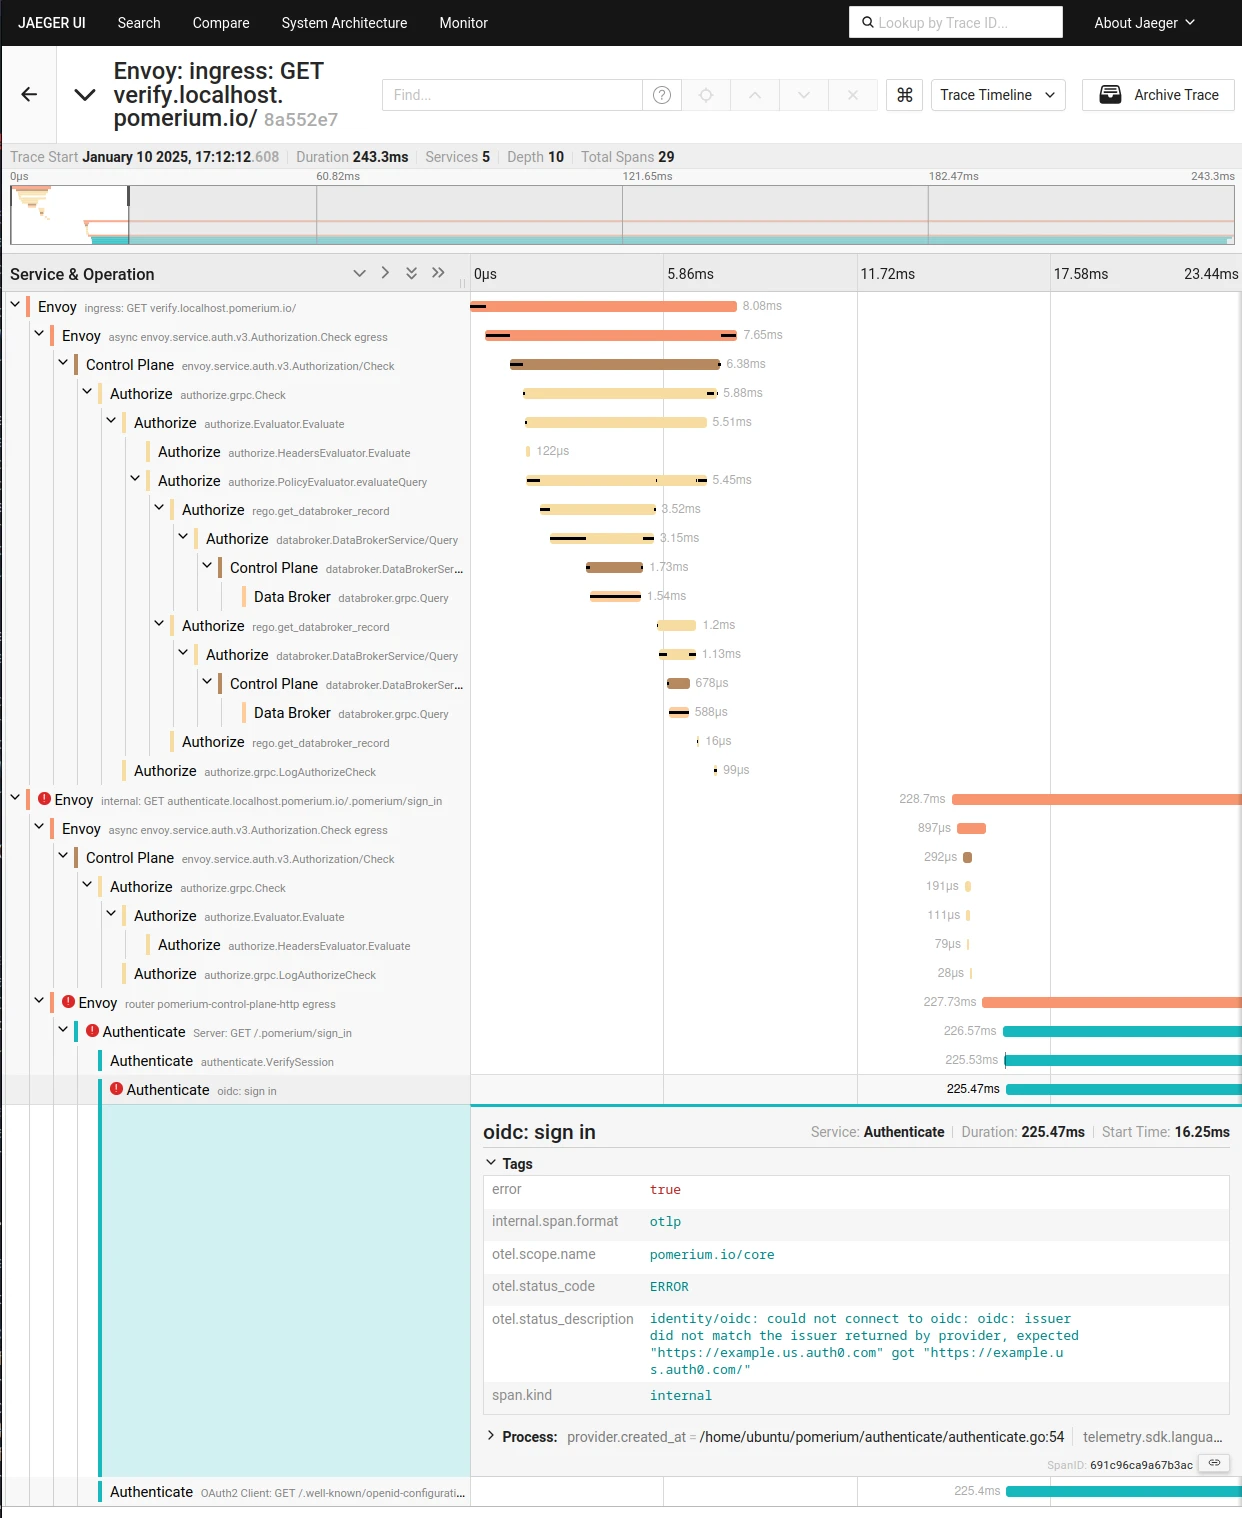
Without proper tracing, debugging complex workflows — like an OAuth login flow that fails after five redirects — becomes guesswork. With tracing, every step becomes visible.
Pomerium now uses the OpenTelemetry SDK to instrument key parts of its architecture:
Envoy: Ingress traffic and HTTP request handling
Authentication: Identity provider interactions
Authorization: Policy evaluation and enforcement
Proxy: Secure traffic forwarding
Data Broker: Internal service communication
Control Plane: Configuration and service coordination
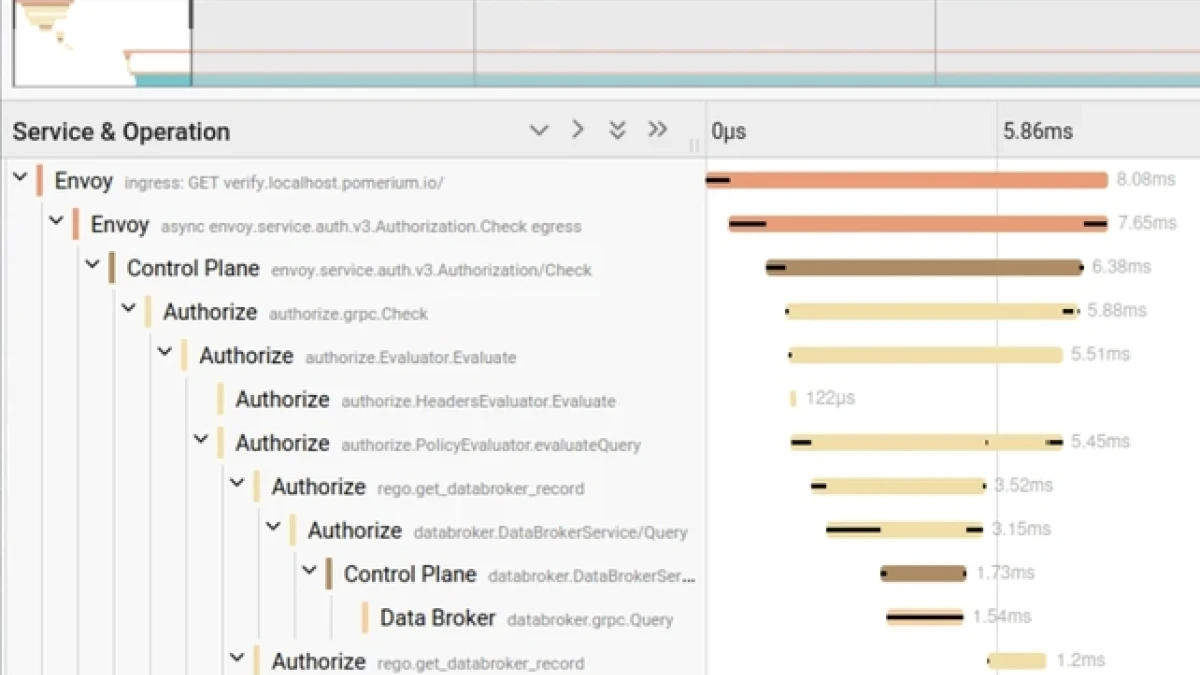
Even when running Pomerium in "all-in-one" mode, traces are logically separated by component (via service names), making it easy to visualize and understand what's happening.
Custom Envoy span naming ensures traces aren’t just blobs of "HTTP Request" events — you’ll see meaningful names including the host, path, and method of each request.
Pomerium’s ability to offer full, detailed tracing starts with its foundation: Envoy Proxy — a modern, battle-tested Layer 7 proxy built for observability and scale.
By building on Envoy, Pomerium inherits:
Scalability: Envoy is designed for cloud-native, high-volume environments.
Feature richness: Native support for advanced protocols, observability, retries, load balancing, and now OTEL tracing — without needing custom patches or hacks.
Reliability: Used in production by companies like Lyft, Apple, and Shopify.
Our close integration with Envoy means your access proxy is future-proofed for modern architectures — and new capabilities like tracing, mTLS, retries, and advanced routing come for free.
Pomerium didn’t just slap tracing on top. We put in significant work — including upstream contributions to Envoy itself — to ensure tracing is accurate, complete, and useful. For example, we identified and fixed a bug in Envoy where spans were sometimes dropped (see PR #37692). This work benefits not only Pomerium users, but the entire Envoy and OpenTelemetry ecosystem.
Distributed tracing isn’t just plug-and-play — especially when redirects are involved.
Pomerium often handles OAuth flows involving 5+ redirects across Identity Providers (IdPs).
However, HTTP redirects don't carry tracing headers, meaning every redirect would normally start a new, separate trace. Combined with trace sampling (necessary for scale), this would shred the trace into useless fragments.
Propagating trace context in query parameters and OAuth state during auth flows.
Ensuring the same sampling decision is carried throughout.
Giving you a single, unified trace for even complex multi-step authentication flows.
This approach preserves full observability — and is something we worked hard to make simple for users, without requiring any special configuration.
Some real-world examples of what Pomerium’s new tracing can help you do:
Understand how Pomerium authenticates users step-by-step
Debug mysterious authentication failures where logs alone don’t provide enough context
Diagnose performance bottlenecks in auth flows or upstream proxying
Analyze network gaps or external system slowness (e.g., slow IdPs or backend apps)
Every trace contains detailed timing, metadata, and authorization decisions — giving you the insight you need to optimize and secure your system.
Tracing isn’t always easy to set up across distributed systems — but we’ve worked hard to make it as simple as possible with Pomerium v0.29.0.
We can’t wait for you to build and uncover insights from to hear what you build — and what insights your new traces uncover!.
Try Pomerium Zero for easier secure access.
Stay up to date with Pomerium news and announcements.
Embrace Seamless Resource Access, Robust Zero Trust Integration, and Streamlined Compliance with Our App.

Use Cases
Quicklinks
Stay Connected
Stay up to date with Pomerium news and announcements.


