Build a Production-Grade Homelab Deployment Pipeline
If your homelab matters, stop deploying it like a side project.
This guide takes one opinionated path: bare metal, Talos Linux, Argo CD, Terraform Cloud, Pomerium Zero, and Grafana as the control room. It is based on a live homelab that currently runs a 9-node Talos cluster, exposes Pomerium through MetalLB, reconciles workloads with Argo CD, and manages Pomerium routes and policies with the official Terraform provider.
The point is not to cosplay a datacenter. The point is to stop losing state, stop inventing drift, and know where to look when something breaks.
Start state and end state
Start here if you want a deployment model with these properties:
- Kubernetes runs on hardware you control
- Git is the source of truth
- Argo CD owns Kubernetes objects
- Terraform owns Pomerium Zero objects
- You want one ingress layer in front of internal services
- You want every change to flow through the same validation loop
By the end of this guide, you will have:
- A Talos-based bare-metal cluster with clear node roles
- A GitOps repo split between Kubernetes manifests and Terraform
- Argo CD continuously reconciling cluster state
- Terraform Cloud managing Pomerium Zero routes, policies, and supported settings
- Pomerium protecting both in-cluster services and selected LAN upstreams
- Observability with Prometheus, Grafana, and OpenTelemetry
- Grafana as the first real operator UI behind Pomerium
- A shipped dashboard for managing the Pomerium cluster itself
What "production-grade" means here
For a homelab, "production-grade" does not mean "copy a hyperscaler."
It means:
- the control plane is intentional
- ownership boundaries are clear
- infrastructure is reproducible
- you do not fix drift by hand
- every change is easy to validate and easy to roll back
If you cannot answer "who owns this change" and "how do I roll it back" in one sentence, the design is not done yet.
The control loop is simple:
This is the reference lab shape behind the guide:
Before you start
This guide assumes:
- Three control-plane nodes (or one to start)
- At least one worker pool
- A dedicated Kubernetes subnet or VLAN
- A domain you control with wildcard DNS
- Router or firewall access for ports
443and80 - A GitHub repository for GitOps state
- A Terraform Cloud organization (free tier)
- A Pomerium Zero account (free tier)
- An identity provider (the reference flow uses Google OAuth)
Tools
brew install siderolabs/tap/talosctl
brew install kubectl
brew install hashicorp/tap/terraform
brew install kubeseal
brew install helm
1. Design the network first
Do not start with YAML. Start with failure domains, IP ranges, and traffic flow.
The live reference lab uses:
- a Kubernetes VLAN on
192.168.10.0/24 - a control-plane VIP at
192.168.10.10 - a MetalLB pool on
192.168.10.100-192.168.10.110 - wildcard DNS that points at one public IP
- router forwards for
443and80into the MetalLB address used by Pomerium
Keep these rules even if your numbers differ:
- Give Kubernetes its own network segment.
- Reserve a stable control-plane VIP.
- Reserve a stable ingress address or range.
- Put one ingress layer in front of everything.
- Keep public DNS simple. A wildcard record is usually enough.
The live lab also separates hardware classes on purpose:
- three Beelink SER5 control-plane nodes
- three Minisforum MS-01 high-performance workers
- three Minisforum UM753 standard workers
That exact hardware is not the point. The point is that the control plane stays small and predictable while worker capacity can change independently.
IP allocation
| Range | Purpose |
|---|---|
| 192.168.10.1 | Gateway |
| 192.168.10.10 | Control plane VIP |
| 192.168.10.11-13 | Control plane nodes |
| 192.168.10.21-23 | HP worker nodes |
| 192.168.10.31-33 | Standard worker nodes |
| 192.168.10.100-110 | MetalLB pool |
DNS flow
*.example.lab
  -> Cloudflare DNS (A record -> public IP)
  -> Router (port forward 443 -> 192.168.10.100)
  -> MetalLB (L2 advertisement -> Pomerium pod)
  -> Pomerium (authenticate -> authorize -> proxy)
  -> Backend service (e.g., verify.verify.svc.cluster.local:80)
2. Bootstrap Talos on bare metal
Talos Linux is a minimal, immutable operating system purpose-built for Kubernetes. There is no SSH, no shell, no package manager. You manage everything through the talosctl API.
Use the latest stable Talos release when you build the cluster. The live-lab snapshot at the end of this guide shows the real cluster state this example is based on.
Generate machine configs
mkdir -p ~/talos/homelab && cd ~/talos/homelab

talosctl gen config homelab https://192.168.10.10:6443 \
  --output-dir .
This creates controlplane.yaml, worker.yaml, and talosconfig.
Configure the control plane VIP
For high availability, configure a shared VIP across your control plane nodes. Each node gets its own static IP, but they all share the VIP. Talos handles failover automatically.
machine:
  network:
    interfaces:
      - interface: enp1s0
        addresses:
          - 192.168.10.11/24
        routes:
          - network: 0.0.0.0/0
            gateway: 192.168.10.1
        vip:
          ip: 192.168.10.10
Apply configs and bootstrap
Flash Talos onto each machine (USB boot or PXE), then apply:
# Control plane
talosctl apply-config --insecure -n 192.168.10.11 -f controlplane.yaml
talosctl apply-config --insecure -n 192.168.10.12 -f controlplane.yaml
talosctl apply-config --insecure -n 192.168.10.13 -f controlplane.yaml

# Workers
talosctl apply-config --insecure -n 192.168.10.21 -f worker.yaml
talosctl apply-config --insecure -n 192.168.10.22 -f worker.yaml
talosctl apply-config --insecure -n 192.168.10.23 -f worker.yaml

# Bootstrap and get kubeconfig
talosctl bootstrap -n 192.168.10.11
talosctl kubeconfig -n 192.168.10.10
kubectl get nodes
Do these four things from the beginning:
- use static addresses for every important node
- give the control plane a VIP
- name every node intentionally
- treat NIC selection as part of the design, not as an afterthought
That last point matters. In the live lab, the most common rack-move failure mode is plugging a node into the wrong interface and watching Talos come up on the wrong network.
3. Create the GitOps repo layout
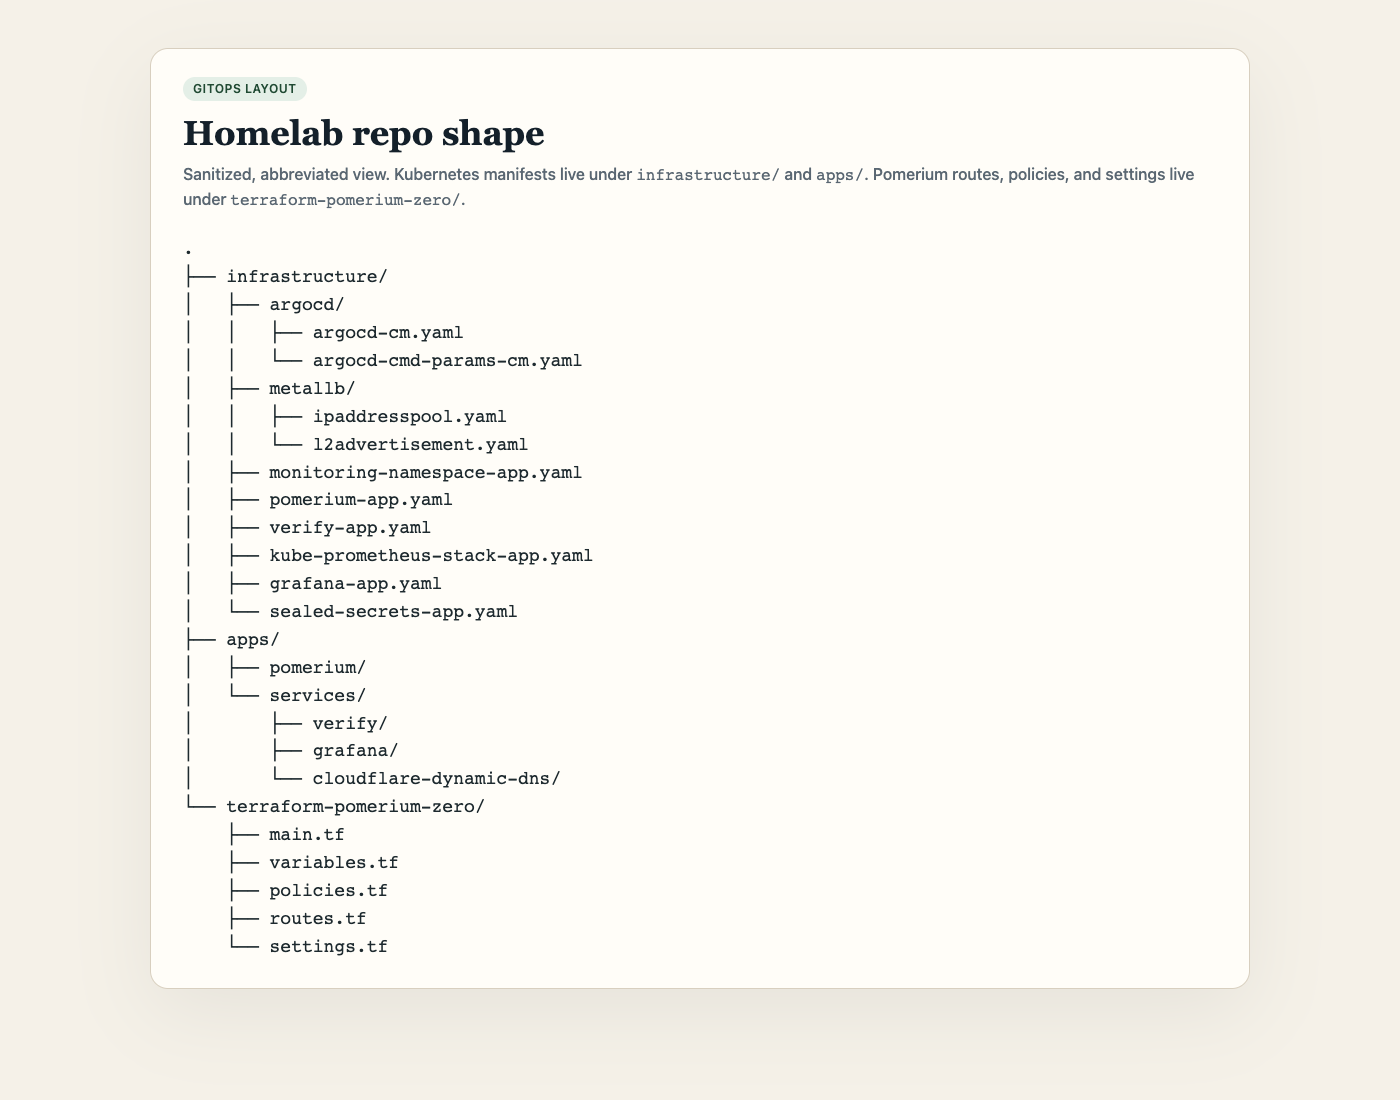
Keep Kubernetes manifests and Terraform in the same repository, but do not mix them in the same directory.
If you are starting fresh, a clean layout looks like this:
homelab-gitops/
├── infrastructure/
│   ├── argocd/
│   ├── metallb/
│   ├── sealed-secrets-app.yaml
│   ├── pomerium-app.yaml
│   └── verify-app.yaml
├── apps/
│   ├── pomerium/
│   └── services/
│       ├── verify/
│       └── cloudflare-ddns/
└── terraform-pomerium/
    ├── main.tf
    ├── variables.tf
    ├── policies.tf
    ├── routes.tf
    └── settings.tf
Use this split consistently:
infrastructure/defines Argo CD Applications and shared platform componentsapps/contains the manifests Argo CD applies into the clusterterraform-pomerium/manages Pomerium Zero state outside the Kubernetes API
The live lab follows the same shape today, with one practical exception: the Terraform working directory is still named terraform-pomerium-zero/. That stale name remains in place to avoid changing the Terraform Cloud working directory during the provider migration. If you are starting fresh, use a cleaner name.
4. Install MetalLB and Argo CD
Install the core control-plane components before you try to deploy services.
MetalLB
In a homelab, there is no cloud provider to hand out LoadBalancer IPs. MetalLB fills that gap using L2 (ARP) advertisement.
apiVersion: metallb.io/v1beta1
kind: IPAddressPool
metadata:
  name: default-pool
  namespace: metallb-system
spec:
  addresses:
    - 192.168.10.100-192.168.10.110
apiVersion: metallb.io/v1beta1
kind: L2Advertisement
metadata:
  name: default
  namespace: metallb-system
spec:
  ipAddressPools:
    - default-pool
MetalLB needs both the IPAddressPool and the L2Advertisement to function. Without the advertisement, the pool never gets announced to the network.
Argo CD
kubectl create namespace argocd
kubectl apply -n argocd --server-side --force-conflicts \
  -f https://raw.githubusercontent.com/argoproj/argo-cd/v3.3.6/manifests/install.yaml
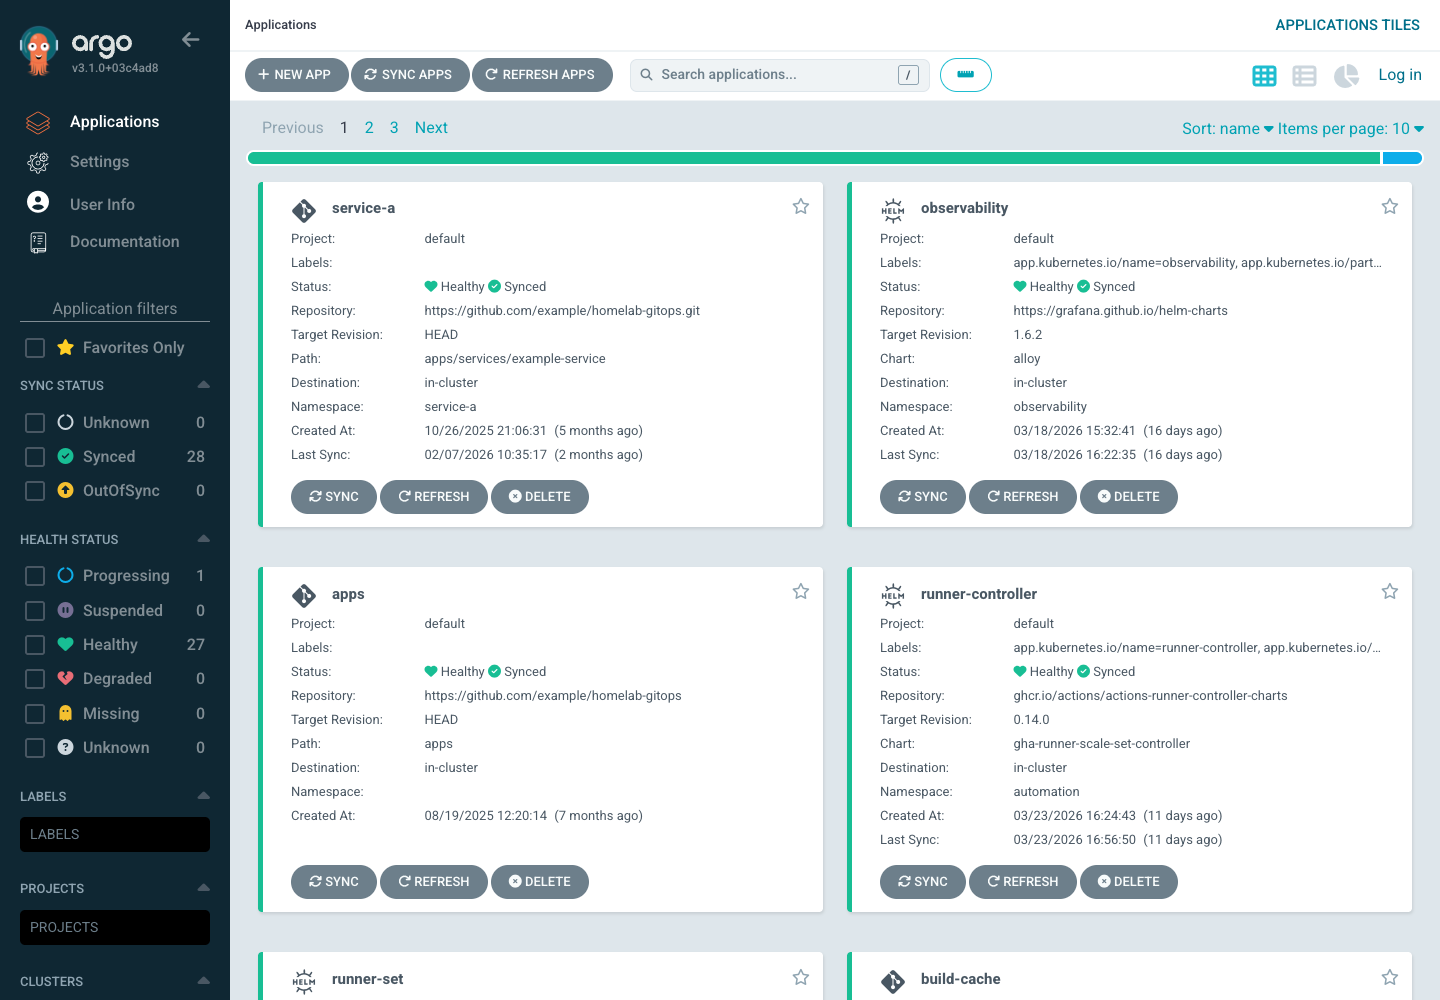
The live lab snapshot later in this guide still shows Argo CD v3.1.0. The install example uses v3.3.6 on purpose so a fresh deployment starts from a newer reviewed release instead of inheriting the lab's upgrade lag.
Switch to the per-application model early. One Application per service or platform component:
- smaller blast radius
- easier sync debugging
- clearer ownership boundaries
- simpler rollback behavior
The Application pattern
Each service gets its own Argo CD Application resource:
apiVersion: argoproj.io/v1alpha1
kind: Application
metadata:
  name: verify
  namespace: argocd
  annotations:
    argocd.argoproj.io/sync-wave: '4'
spec:
  project: default
  source:
    repoURL: https://github.com/your-org/homelab-k8s-gitops.git
    targetRevision: main
    path: apps/services/verify
  destination:
    server: https://kubernetes.default.svc
    namespace: verify
  syncPolicy:
    automated:
      prune: true
      selfHeal: true
    retry:
      limit: 5
      backoff:
        duration: 5s
        factor: 2
        maxDuration: 3m
    syncOptions:
      - CreateNamespace=true
      - PruneLast=true
prune: Deletes resources from the cluster that no longer exist in GitselfHeal: Reverts manual changes made directly to the clusterretry: Exponential backoff on sync failures during bootstrapsync-wave: Controls deployment order -- CRDs and infrastructure (wave 0-1) before applications (wave 2+)
Disable Argo CD built-in auth
Since Pomerium handles authentication, disable Argo CD's built-in auth:
apiVersion: v1
kind: ConfigMap
metadata:
  name: argocd-cmd-params-cm
  namespace: argocd
data:
  server.disable.auth: 'true'
  server.insecure: 'true'
With server.disable.auth set to true, Pomerium handles all authentication at the proxy layer. The OIDC config below is optional -- it tells Argo CD how to resolve user identity from Pomerium's JWT so the UI can display who is logged in:
Only disable Argo CD's built-in auth if the UI is reachable exclusively through a correctly protected Pomerium route. If the from URL, attached policy, or ingress path is wrong, anything that can reach the service endpoint can reach the Argo CD UI without its own login prompt.
apiVersion: v1
kind: ConfigMap
metadata:
  name: argocd-cm
  namespace: argocd
data:
  url: 'https://argocd.example.lab'
  oidc.config: |
    name: Pomerium
    issuer: https://authn.example.lab
    clientId: argocd
    requestedScopes: ["openid", "profile", "email", "groups"]
DNS with Cloudflare
If you have a residential IP, set up a DDNS cronjob so *.example.lab stays pointed at your public IP:
apiVersion: batch/v1
kind: CronJob
metadata:
  name: cloudflare-ddns
  namespace: cloudflare-ddns
spec:
  schedule: '*/5 * * * *'
  concurrencyPolicy: Forbid
  jobTemplate:
    spec:
      template:
        spec:
          restartPolicy: OnFailure
          containers:
            - name: updater
              image: python:3.12-slim
              envFrom:
                - configMapRef:
                    name: cloudflare-ddns-config
                - secretRef:
                    name: cloudflare-ddns-secret
              command: ['/bin/sh', '-c']
              args:
                - python3 /opt/ddns/ddns.py
              volumeMounts:
                - name: script
                  mountPath: /opt/ddns
                  readOnly: true
          volumes:
            - name: script
              configMap:
                name: cloudflare-ddns-config
                items:
                  - key: ddns.py
                    path: ddns.py
Store the Python script as a key in a ConfigMap and the Cloudflare API token as a Secret (sealed with kubeseal, covered in Seal your secrets).
Forward ports 443 and 80 on your router to the Pomerium MetalLB IP (192.168.10.100). All HTTPS traffic routes through Pomerium, which handles TLS, authentication, and proxying.
Checkpoint after this section:
kubectl get pods -n metallb-systemkubectl get pods -n argocdkubectl get applications -n argocd
You should see MetalLB and Argo CD running before you move on to workload deployment.
5. Seal your secrets
Secrets do not belong in Git -- but the encrypted versions do. Sealed Secrets encrypts your secrets with a cluster-specific key. Only the controller running in your cluster can decrypt them.
Deploy it as a Helm-based Argo CD Application at sync wave 0 (before anything else needs secrets):
apiVersion: argoproj.io/v1alpha1
kind: Application
metadata:
  name: sealed-secrets
  namespace: argocd
  annotations:
    argocd.argoproj.io/sync-wave: '0'
spec:
  project: default
  source:
    repoURL: https://bitnami-labs.github.io/sealed-secrets
    chart: sealed-secrets
    targetRevision: 2.16.2
    helm:
      releaseName: sealed-secrets
      values: |
        fullnameOverride: sealed-secrets
  destination:
    server: https://kubernetes.default.svc
    namespace: sealed-secrets
  syncPolicy:
    automated:
      prune: true
      selfHeal: true
    syncOptions:
      - CreateNamespace=true
Create and seal a secret:
# Create a plain secret (never commit this)
kubectl -n cloudflare-ddns create secret generic cloudflare-ddns-secret \
  --from-literal=CF_API_TOKEN=your-cloudflare-token \
  --from-literal=CF_ZONE_NAME=example.com \
  --from-literal=CF_RECORDS="example.lab,*.example.lab" \
  --dry-run=client -o yaml > /tmp/secret.yaml

# Seal it
kubeseal --format yaml < /tmp/secret.yaml \
  > apps/services/cloudflare-ddns/secret.sealed.yaml

# Clean up
rm /tmp/secret.yaml
Commit the sealed secret. Argo CD syncs it, the controller decrypts it, the plain secret exists only inside the cluster.
If a token such as the Cloudflare DDNS API credential expires, rotate the plain Secret source, reseal it, commit the updated sealed manifest, and let Argo CD reconcile the replacement.
6. Deploy Pomerium in the cluster
This guide uses Pomerium Zero as the control plane and runs Pomerium in the cluster as the data plane.
- Sign in to the Pomerium Zero Console
- Create a new cluster and copy the token
- Configure your identity provider (Google OAuth in this guide)
Set the authenticate URL in the Pomerium Zero Console to https://authn.example.lab. Your *.example.lab wildcard DNS record covers it automatically.
Deploy Pomerium as an Argo CD-managed application:
apiVersion: v1
kind: Namespace
metadata:
  name: pomerium
---
apiVersion: apps/v1
kind: Deployment
metadata:
  name: pomerium
  namespace: pomerium
spec:
  replicas: 1
  selector:
    matchLabels:
      app: pomerium
  template:
    metadata:
      labels:
        app: pomerium
      annotations:
        prometheus.io/scrape: 'true'
        prometheus.io/port: '9090'
    spec:
      containers:
        - name: pomerium
          image: pomerium/pomerium:v0.32.3
          env:
            - name: POMERIUM_ZERO_TOKEN
              valueFrom:
                secretKeyRef:
                  name: pomerium-zero-token
                  key: token
            - name: POMERIUM_METRICS_ADDRESS
              value: ':9090'
          ports:
            - containerPort: 443
              name: https
            - containerPort: 80
              name: http
            - containerPort: 9090
              name: metrics
          readinessProbe:
            httpGet:
              path: /ping
              port: 443
              scheme: HTTPS
            initialDelaySeconds: 5
            periodSeconds: 10
          livenessProbe:
            httpGet:
              path: /ping
              port: 443
              scheme: HTTPS
            initialDelaySeconds: 15
            periodSeconds: 30
          resources:
            requests:
              memory: 256Mi
              cpu: 250m
            limits:
              memory: 512Mi
              cpu: 500m
          volumeMounts:
            - name: databroker-storage
              mountPath: /var/pomerium/databroker
      volumes:
        - name: databroker-storage
          emptyDir: {}
---
apiVersion: v1
kind: Service
metadata:
  name: pomerium
  namespace: pomerium
  annotations:
    metallb.universe.tf/loadBalancerIPs: '192.168.10.100'
spec:
  type: LoadBalancer
  selector:
    app: pomerium
  ports:
    - name: https
      port: 443
      targetPort: 443
    - name: http
      port: 80
      targetPort: 80
The metallb.universe.tf/loadBalancerIPs annotation pins the LoadBalancer to a specific IP. This is the IP your router port-forwards to.
For a durable data plane, back Pomerium's databroker storage with a persistent volume. The manifest above uses emptyDir as a starting point; replace it with a PVC when you are ready to persist state across restarts.
Checkpoint after this section:
kubectl -n pomerium get pods,svckubectl -n pomerium logs deploy/pomerium --tail=20
You should see the Pomerium pod become Running and the Service receive the MetalLB address you reserved for the edge.
The live lab currently runs a git- tagged Pomerium image to dogfood in-flight work. Do not copy that by default. This example pins v0.32.3 as a concrete stable starting point. Update intentionally after checking the current release notes.
7. Manage Pomerium Zero with Terraform
This is where the pipeline comes together. Instead of clicking through a UI to create routes, you define them as Terraform resources in your Git repository.
The official Pomerium Terraform provider works with Pomerium Zero, Core, and Enterprise. Same provider, same resources, same workflow.
Provider configuration
terraform {
  required_version = ">= 1.6.0"

  required_providers {
    pomerium = {
      source  = "pomerium/pomerium"
      version = "~> 0.32.0"
    }
  }
}

provider "pomerium" {
  api_url               = "https://console.pomerium.app"
  service_account_token = var.pomerium_api_token
}
Define policies
resource "pomerium_policy" "trusted_users" {
  namespace_id = var.namespace_id
  name         = "trusted_users"
  description  = "Trusted users with full homelab access"
  enforced     = true

  ppl = jsonencode([{
    allow = {
      or = [
        { email = { ends_with = var.allowed_email_domain } },
      ]
    }
  }])
}
Define routes
Each route maps an external URL to an internal service:
resource "pomerium_route" "verify" {
  namespace_id = var.namespace_id
  name         = "verify"
  from         = "https://verify.example.lab"
  to           = ["http://verify.verify.svc.cluster.local:80"]

  policies             = [pomerium_policy.trusted_users.id]
  preserve_host_header = true
  timeout              = "30s"
  idle_timeout         = "300s"
}

resource "pomerium_route" "argocd" {
  namespace_id = var.namespace_id
  name         = "ArgoCD Interface"
  from         = "https://argocd.example.lab"
  to           = ["http://argocd-server.argocd.svc.cluster.local:80"]

  policies             = [pomerium_policy.trusted_users.id]
  allow_websockets     = true
  preserve_host_header = true
  timeout              = "60s"
  idle_timeout         = "600s"
}

resource "pomerium_route" "grafana" {
  namespace_id = var.namespace_id
  name         = "Grafana"
  from         = "https://grafana.example.lab"
  to           = ["http://grafana.grafana.svc.cluster.local:3000"]

  policies             = [pomerium_policy.trusted_users.id]
  allow_websockets     = true
  preserve_host_header = true
  timeout              = "60s"
  idle_timeout         = "600s"

  set_request_headers = {
    "X-Environment" = "homelab"
    "X-Tool"        = "grafana"
  }
}
Configure cluster settings
resource "pomerium_settings" "homelab" {
  cluster_id = var.cluster_id

  address           = ":443"
  dns_lookup_family = "V4_ONLY"
  log_level         = "info"
  metrics_address   = ":9090"

  authenticate_service_url = "https://authn.example.lab"
  idp_provider             = "google"
  idp_client_id            = var.idp_client_id
  idp_client_secret        = var.idp_client_secret
  scopes                   = ["openid", "profile", "email"]

  cookie_name      = "_pomerium_homelab"
  cookie_http_only = true
  cookie_expire    = "24h"
  cookie_same_site = "lax"

  default_upstream_timeout = "30s"
  pass_identity_headers    = true
}
Set up Terraform Cloud
Terraform Cloud provides remote state, VCS-triggered runs, and team collaboration -- all on the free tier.
- Create an organization and workspace connected to your GitHub repository
- Set the working directory to
terraform-pomerium/ - Add variables as environment category (not Terraform category -- see note below):
| Variable | Type | Sensitive |
|---|---|---|
TF_VAR_pomerium_api_token | Environment | Yes |
TF_VAR_idp_client_id | Environment | No |
TF_VAR_idp_client_secret | Environment | Yes |
TF_VAR_cluster_id | Environment | No |
TF_VAR_namespace_id | Environment | No |
- Configure the backend:
terraform {
  cloud {
    organization = "your-homelab"
    workspaces { name = "homelab-k8s-gitops" }
  }
}
The VCS-triggered workflow: push a route change to main, Terraform Cloud plans, auto-apply applies, Pomerium picks up the new configuration.
Treat Terraform rollback as its own workflow. Argo CD's selfHeal will revert Kubernetes drift, but it will not undo route or policy changes in Pomerium Zero for you.
For route and policy mistakes:
- review the plan before apply
- revert the HCL in Git if you need to back out a change
- re-run
terraform planandterraform applyto return Pomerium Zero to the previous state - reserve
terraform destroyfor disposable environments, not your primary homelab
If you use Terraform Cloud on the free tier, expect queued plans when another run is already in progress.
The live lab has a few migration details worth knowing about:
- the active provider endpoint is
https://console.pomerium.app, not the older Console API URL pattern - the token used here is a Pomerium Zero API Access token
- the live Terraform Cloud workspace still points at
terraform-pomerium-zero/ - Terraform Cloud inputs are stored as environment-category
TF_VAR_*variables because terraform-category vars are materialized at the repo root instead of the configured subdirectory pomerium_settingsstill has provider caveats in this area; the live lab omits fields that normalize badly at apply time, including the currentskip_xff_appendnull behavior
These are live-lab details, not the default public path. Start with the released provider first.
Checkpoint after this section:
- confirm the Terraform run planned or applied successfully
curl -I https://verify.example.lab
Before you continue, you should be able to get a 302 redirect from a protected route instead of a missing-route or upstream-failure response.
8. Put Argo CD on the Kubernetes side and Terraform on the Pomerium side
This ownership split is the core design decision in the guide.
Treat it as a hard boundary, not a suggestion:
Use Argo CD to own:
- namespaces
- deployments
- services
- ingress-adjacent Kubernetes resources
- observability stack components
- any object that naturally belongs in the Kubernetes API
Use Terraform to own:
- Pomerium settings
- Pomerium policies
- Pomerium routes
Do not make Argo CD and Terraform fight over the same object class.
In the live lab, that means:
apps/pomerium/deploys the Pomerium pod and Service into Kubernetesterraform-pomerium-zero/manages the Zero-side route and policy model
That separation is what keeps the system understandable when you come back to it six months later.
9. Start with verify, then make Grafana canonical
Use a small service to prove the control loop before you protect real systems.
The live lab starts with verify, and that is still the right move.
apiVersion: v1
kind: Namespace
metadata:
  name: verify
---
apiVersion: apps/v1
kind: Deployment
metadata:
  name: verify
  namespace: verify
spec:
  replicas: 1
  selector:
    matchLabels:
      app: verify
  template:
    metadata:
      labels:
        app: verify
    spec:
      containers:
        - name: verify
          image: pomerium/verify:latest
          ports:
            - containerPort: 8000
              name: http
          readinessProbe:
            httpGet:
              path: /
              port: 8000
            initialDelaySeconds: 5
            periodSeconds: 10
          resources:
            requests:
              cpu: 10m
              memory: 32Mi
            limits:
              cpu: 100m
              memory: 64Mi
---
apiVersion: v1
kind: Service
metadata:
  name: verify
  namespace: verify
spec:
  type: ClusterIP
  selector:
    app: verify
  ports:
    - name: http
      port: 80
      targetPort: 8000
Unlike the other components in this guide, pomerium/verify publishes only rolling tags (latest, main, sha-*), so it is intentionally not version-pinned. It is a throwaway test app, not part of your real workload set.
Push the manifests and the Terraform route. Argo CD deploys the app, Terraform creates the route, Pomerium starts proxying.
Visit https://verify.example.lab. You should get a 302 redirect to your identity provider. After authenticating, you will see the verify page with your identity headers.
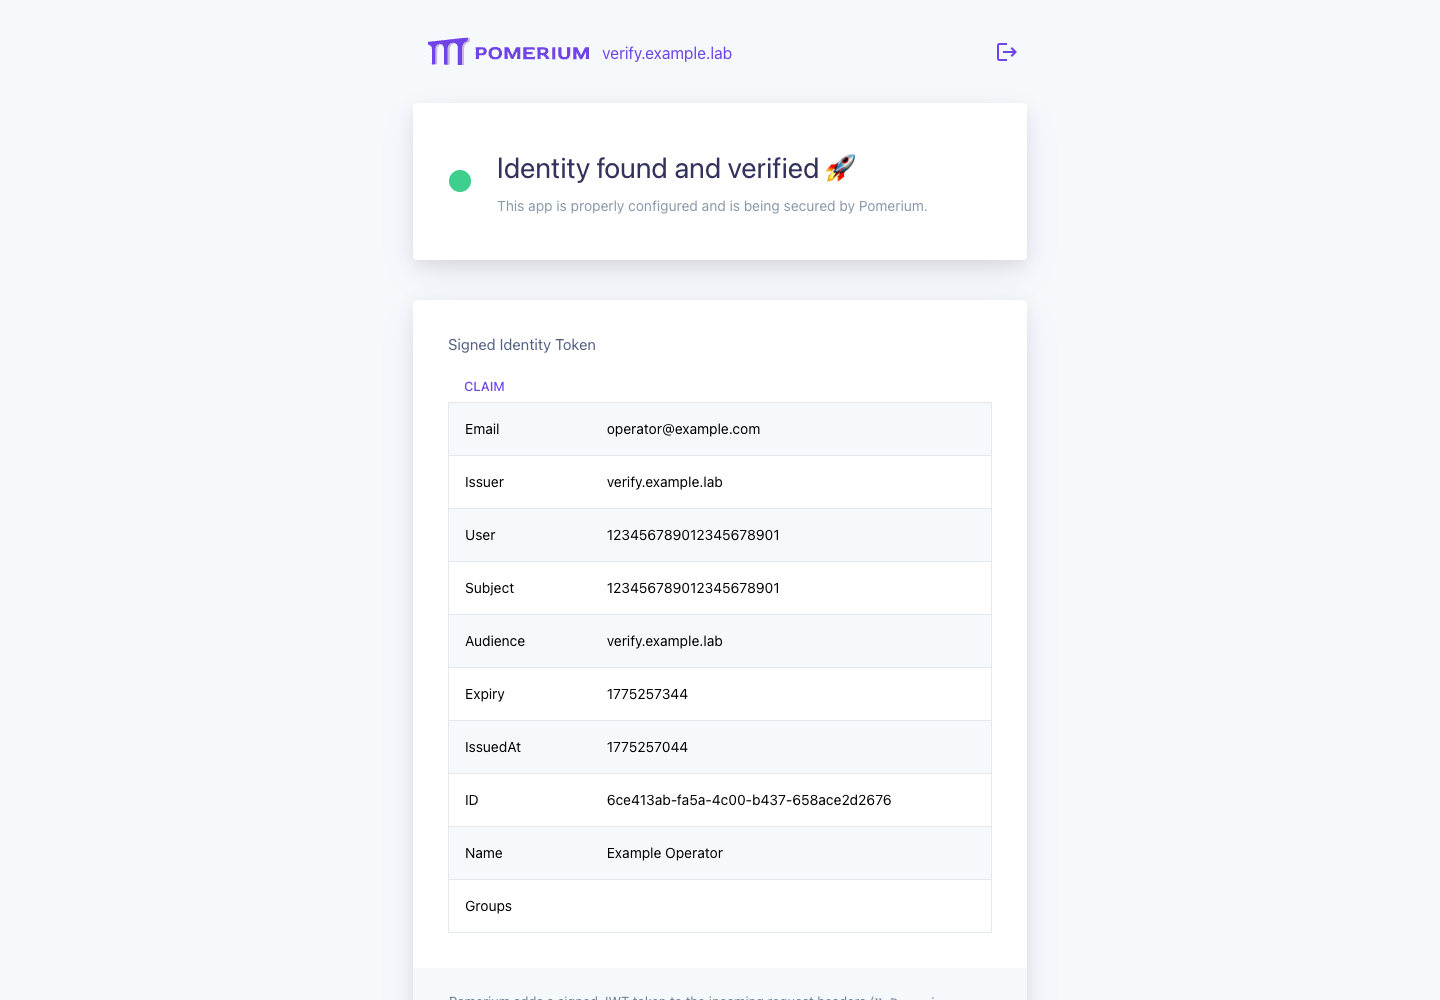
Your first protected service should let you confirm:
- Argo CD can reconcile the workload
- the upstream Service is healthy
- Terraform can create the route
- unauthenticated traffic gets a
302redirect to the authenticate service - authenticated traffic reaches the upstream cleanly
- a user your policy excludes is sent to sign in and then denied, never reaching the upstream
This is the pattern for every service you add: Kubernetes manifests in apps/, an Argo CD Application in infrastructure/, and a Terraform route in terraform-pomerium/.
After verify, do not jump straight to a random pile of apps. Protect Grafana next.
verify proves the pipe. Grafana keeps you out of the dark.
Grafana is the canonical second service because it answers the question that actually matters after bring-up: is the lab healthy, or are you about to waste an hour debugging blind.
Then make Grafana trust Pomerium and land on the right dashboard:
env:
  - name: GF_SERVER_ROOT_URL
    value: https://grafana.example.lab
  - name: GF_AUTH_PROXY_ENABLED
    value: 'true'
  - name: GF_AUTH_PROXY_HEADER_NAME
    value: X-Pomerium-User
  - name: GF_AUTH_PROXY_WHITELIST
    value: 'YOUR_CLUSTER_INTERNAL_CIDR'
  - name: GF_AUTH_PROXY_HEADERS
    value: Name:X-Pomerium-Claim-Name,Email:X-Pomerium-Claim-Email,Login:X-Pomerium-User
  - name: GF_AUTH_PROXY_AUTO_SIGN_UP
    value: 'true'
  - name: GF_AUTH_DISABLE_LOGIN_FORM
    value: 'true'
  - name: GF_USERS_AUTO_ASSIGN_ORG_ROLE
    value: Viewer
  - name: GF_DASHBOARDS_DEFAULT_HOME_DASHBOARD_PATH
    value: /var/lib/grafana/dashboards/pomerium-cluster-control-room.json
Replace YOUR_CLUSTER_INTERNAL_CIDR with the pod CIDR or other internal source-network CIDR that can actually reach Grafana from the Pomerium side in your cluster.
Confirm the Grafana auth-proxy environment variables against the Grafana version you deploy. Auth proxy settings move over time, but the core requirement does not: only trust headers from the Pomerium-side network path you control.
Argo CD is still important, but Grafana should be the first operator UI you reach for once the pipe works. Argo tells you whether desired state converged. Grafana tells you whether the system is actually healthy.
Two rules matter here:
- do not leave Grafana reachable except through Pomerium
- restrict the auth proxy whitelist to the CIDR that can actually reach Grafana from the Pomerium side
10. Ship the dashboard
Do not protect Grafana and then land on a blank page.
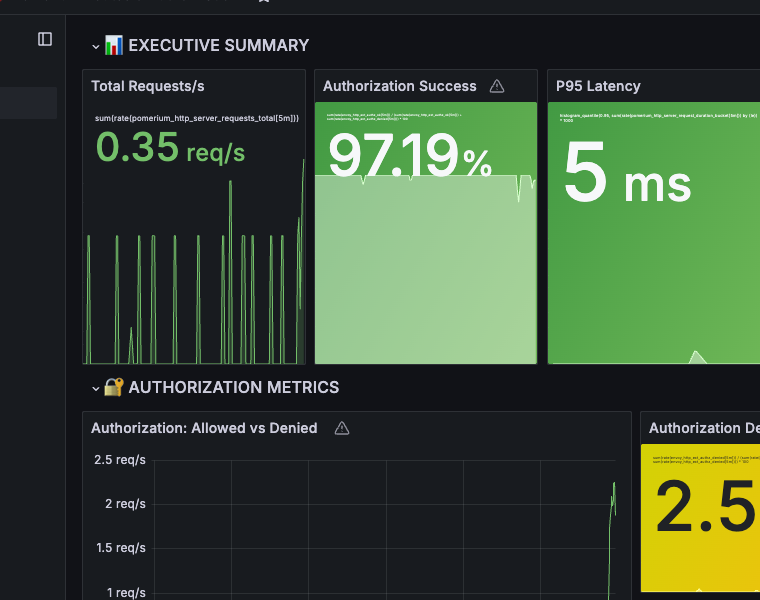
Ship one landing dashboard that acts like a control room, not a screenshot wall.
It should answer these questions in under 10 seconds:
- are requests flowing
- are authorization decisions succeeding
- is latency rising
- are the Pomerium pods healthy
- which route is getting noisy
This guide now ships a dashboard bundle in the docs repo:
It includes:
pomerium-cluster-control-room.jsonfor direct import into Grafanadashboard-configmap.yamlfor Kubernetes provisioning
The dashboard is derived from the live lab's existing pomerium-consolidated and homelab-ops-control dashboards. It is smaller, but it keeps the same intent: fast triage first, drill-down second.
Treat the JSON file as the source of truth. If you provision Grafana from files, UI edits are temporary and will be overwritten on the next reprovision or restart.
11. Add observability
Deploy Prometheus for metrics, Grafana for dashboards, and OpenTelemetry for traces. Do not wait until after your first outage.
Prometheus and Grafana
apiVersion: argoproj.io/v1alpha1
kind: Application
metadata:
  name: kube-prometheus-stack
  namespace: argocd
  annotations:
    argocd.argoproj.io/sync-wave: '2'
spec:
  project: default
  source:
    repoURL: https://prometheus-community.github.io/helm-charts
    chart: kube-prometheus-stack
    targetRevision: '65.0.0'
    helm:
      releaseName: kube-prometheus-stack
  destination:
    server: https://kubernetes.default.svc
    namespace: monitoring
  syncPolicy:
    automated:
      prune: true
      selfHeal: true
    syncOptions:
      - CreateNamespace=true
      - ServerSideApply=true
Pin the chart version you have actually reviewed. Do not leave this on a floating semver range if the rest of the stack is supposed to move intentionally.
Pomerium telemetry
Configure Pomerium to send traces and metrics by adding these environment variables to the deployment:
- name: OTEL_TRACES_EXPORTER
  value: otlp
- name: OTEL_EXPORTER_OTLP_ENDPOINT
  value: otel-collector.observability.svc.cluster.local:4317
- name: OTEL_EXPORTER_OTLP_PROTOCOL
  value: grpc
- name: OTEL_EXPORTER_OTLP_INSECURE
  value: 'true'
- name: OTEL_TRACES_SAMPLER
  value: parentbased_traceidratio
- name: OTEL_TRACES_SAMPLER_ARG
  value: '1.0'
Pomerium also exposes a Prometheus metrics endpoint on :9090. Use the prometheus.io/scrape pod annotation (already in the deployment above) to scrape it.
Add a Terraform route for Grafana (shown in the routes section above). After Terraform applies, visit https://grafana.example.lab, authenticate through Pomerium, and you will land in Grafana with your Pomerium metrics available.
12. Troubleshoot the common failures
Use the same failure model every time: identify the symptom, confirm which system owns the broken state, then check the smallest number of things that can prove or disprove that theory.
| Symptom | Likely cause | What to check | Fix |
|---|---|---|---|
504 after a Terraform route change | Argo CD has not synced the Service or Deployment yet | kubectl get pods -n verify, kubectl get applications -n argocd | Wait for Argo CD to finish, then re-test the route |
| Pomerium pod crashes on start | POMERIUM_ZERO_TOKEN is missing or invalid | kubectl logs -n pomerium deploy/pomerium | Recreate or reseal the token secret and let Argo CD sync it |
Argo CD stays OutOfSync after a Terraform run | Terraform and Argo CD are crossing ownership boundaries | Check whether Terraform is trying to manage Kubernetes objects | Move Kubernetes ownership back into Argo CD and keep Terraform on the Zero side only |
302 loops on a protected route | authenticate_service_url, route hostnames, or Argo CD OIDC issuer do not match | Check authn.example.lab reachability and the configured issuer URLs | Align the Pomerium authenticate URL, route from values, and OIDC issuer settings |
| MetalLB never assigns an ingress IP | L2Advertisement or pool config is missing or wrong | kubectl describe svc pomerium -n pomerium, kubectl get ipaddresspools,l2advertisements -n metallb-system | Apply or fix the MetalLB pool and advertisement manifests |
13. Validate every change the same way
This is a multi-component infrastructure guide (bare-metal Talos Kubernetes, Terraform Cloud, Argo CD, and a hosted Pomerium Zero control plane). There is no single command that proves the whole pipeline, so verify each layer against your own cluster using the checks below and the per-section checkpoints. The install versions here are normalized for a fresh deployment and differ from the live-lab snapshot, so treat them as a reviewed starting point rather than an exact replica.
Treat the control loop as part of the system, not as background plumbing.
For every change:
- Confirm GitHub automation is green
- Confirm Terraform Cloud planned or applied successfully
- Confirm Argo CD is
SyncedandHealthy - Confirm there are no broken pods
- Confirm the route behavior with
curl -I
Typical route test:
curl -I https://verify.example.lab
Expected behavior for a protected route:
302redirect to the authenticate endpoint when unauthenticated- not
404(route missing) - not
502(upstream down) - not
503(Pomerium overloaded)
Run this against each protected route -- verify, grafana, and argocd -- and confirm every one returns a 302 redirect to the authenticate service while its Argo CD application stays Synced and Healthy.
14. Current live lab snapshot
This example is based on a real lab. At the time of writing, that cluster was running:
| Category | Current state |
|---|---|
| Kubernetes | v1.33.3 |
| Talos | v1.12.2 |
| Argo CD | v3.1.0 |
| Pomerium | git-7cb5e0f7 |
| Terraform provider | pomerium/pomerium v0.32.0 |
| Nodes | 9 total (3 CP + 3 HP + 3 Std) |
| Control plane VIP | 192.168.10.10 |
| MetalLB range | 192.168.10.100-192.168.10.110 |
The snippets above are not a byte-for-byte export of that repo. Where the live lab carries migration or upgrade lag, the guide uses a newer reviewed version instead -- for example Argo CD v3.3.6 in the install step versus the lab's running v3.1.0, and a stable Pomerium image instead of the lab's dogfood build.
Next steps
Once this baseline works, add complexity carefully:
- Move more workloads behind Pomerium
- Make Grafana the control room before the first real outage
- Add another worker class before you need it
- Add backup and storage plans before you need them
- Keep the rollback rules simple
Explore Pomerium capabilities:
- MCP server access -- Secure access to MCP servers through Pomerium
- SSH access -- SSH to cluster nodes through Pomerium
- TCP routes -- Proxy TCP connections (databases, Redis, etc.)
Upgrade to Enterprise: For teams, Pomerium Enterprise adds device trust, session recording, audit log streaming, and centralized management.
If you are also working through the consolidated Terraform and ingress documentation, use this guide as the deployment narrative and treat the reference pages as the option matrix.